Limited Time Offer
Limited Time Offer
Limited Time Offer
Limited Time Offer
Limited Time Offer
Limited Time Offer
Limited Time Offer
Limited Time Offer
GET JOB-READY WITH THIS 7-IN-1 DATA ANALYSIS COURSE EXCEL, AI, POWER BI, PYTHON & SQL!💼
Future-Proof Your Career: Master Data Analysis Skills in 2026 and Stay Ahead of the Curve!
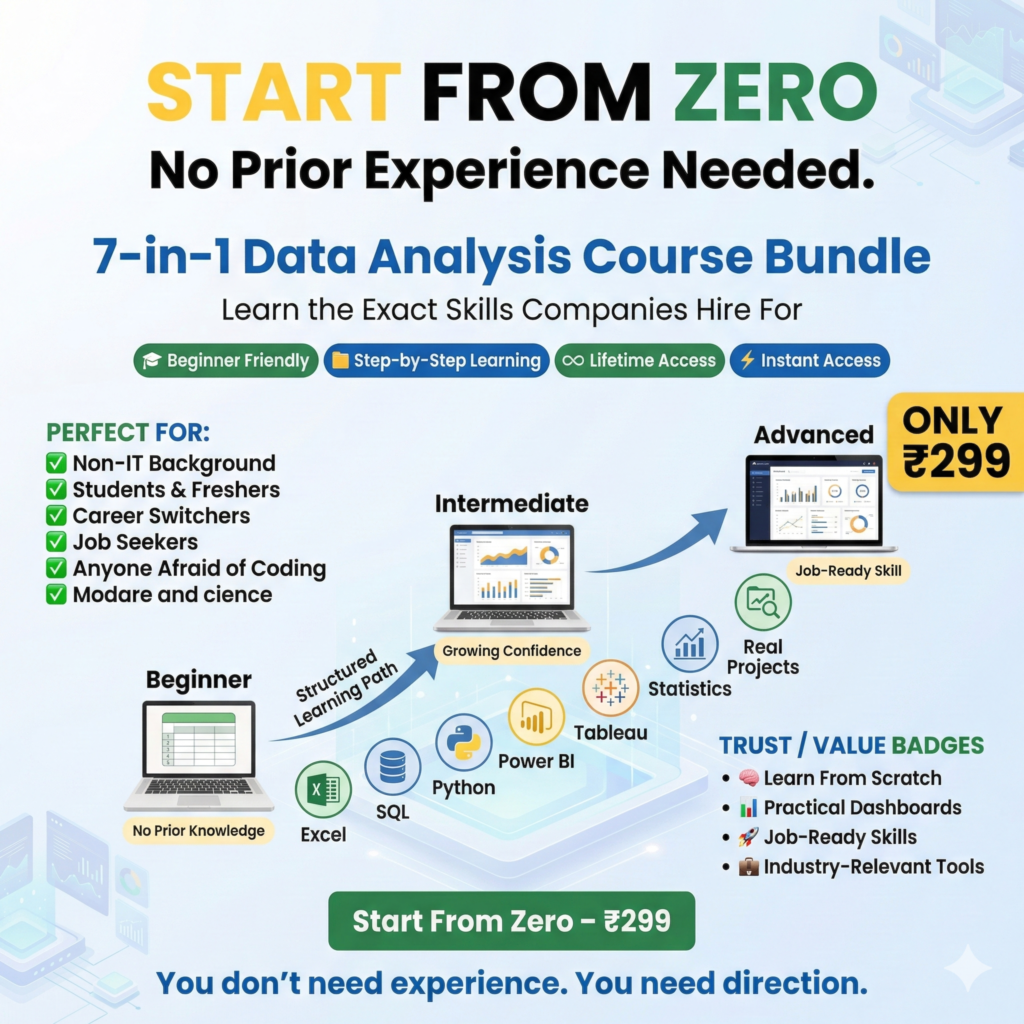
- Why Choose Our 7‑in‑1 Data Analysis Mastery Bundle?
- Experts‑Led Training
- High-Demand Skills
- Updated for 2025
- Lifetime Access
- Affordable & Value-Packed
- Community Support
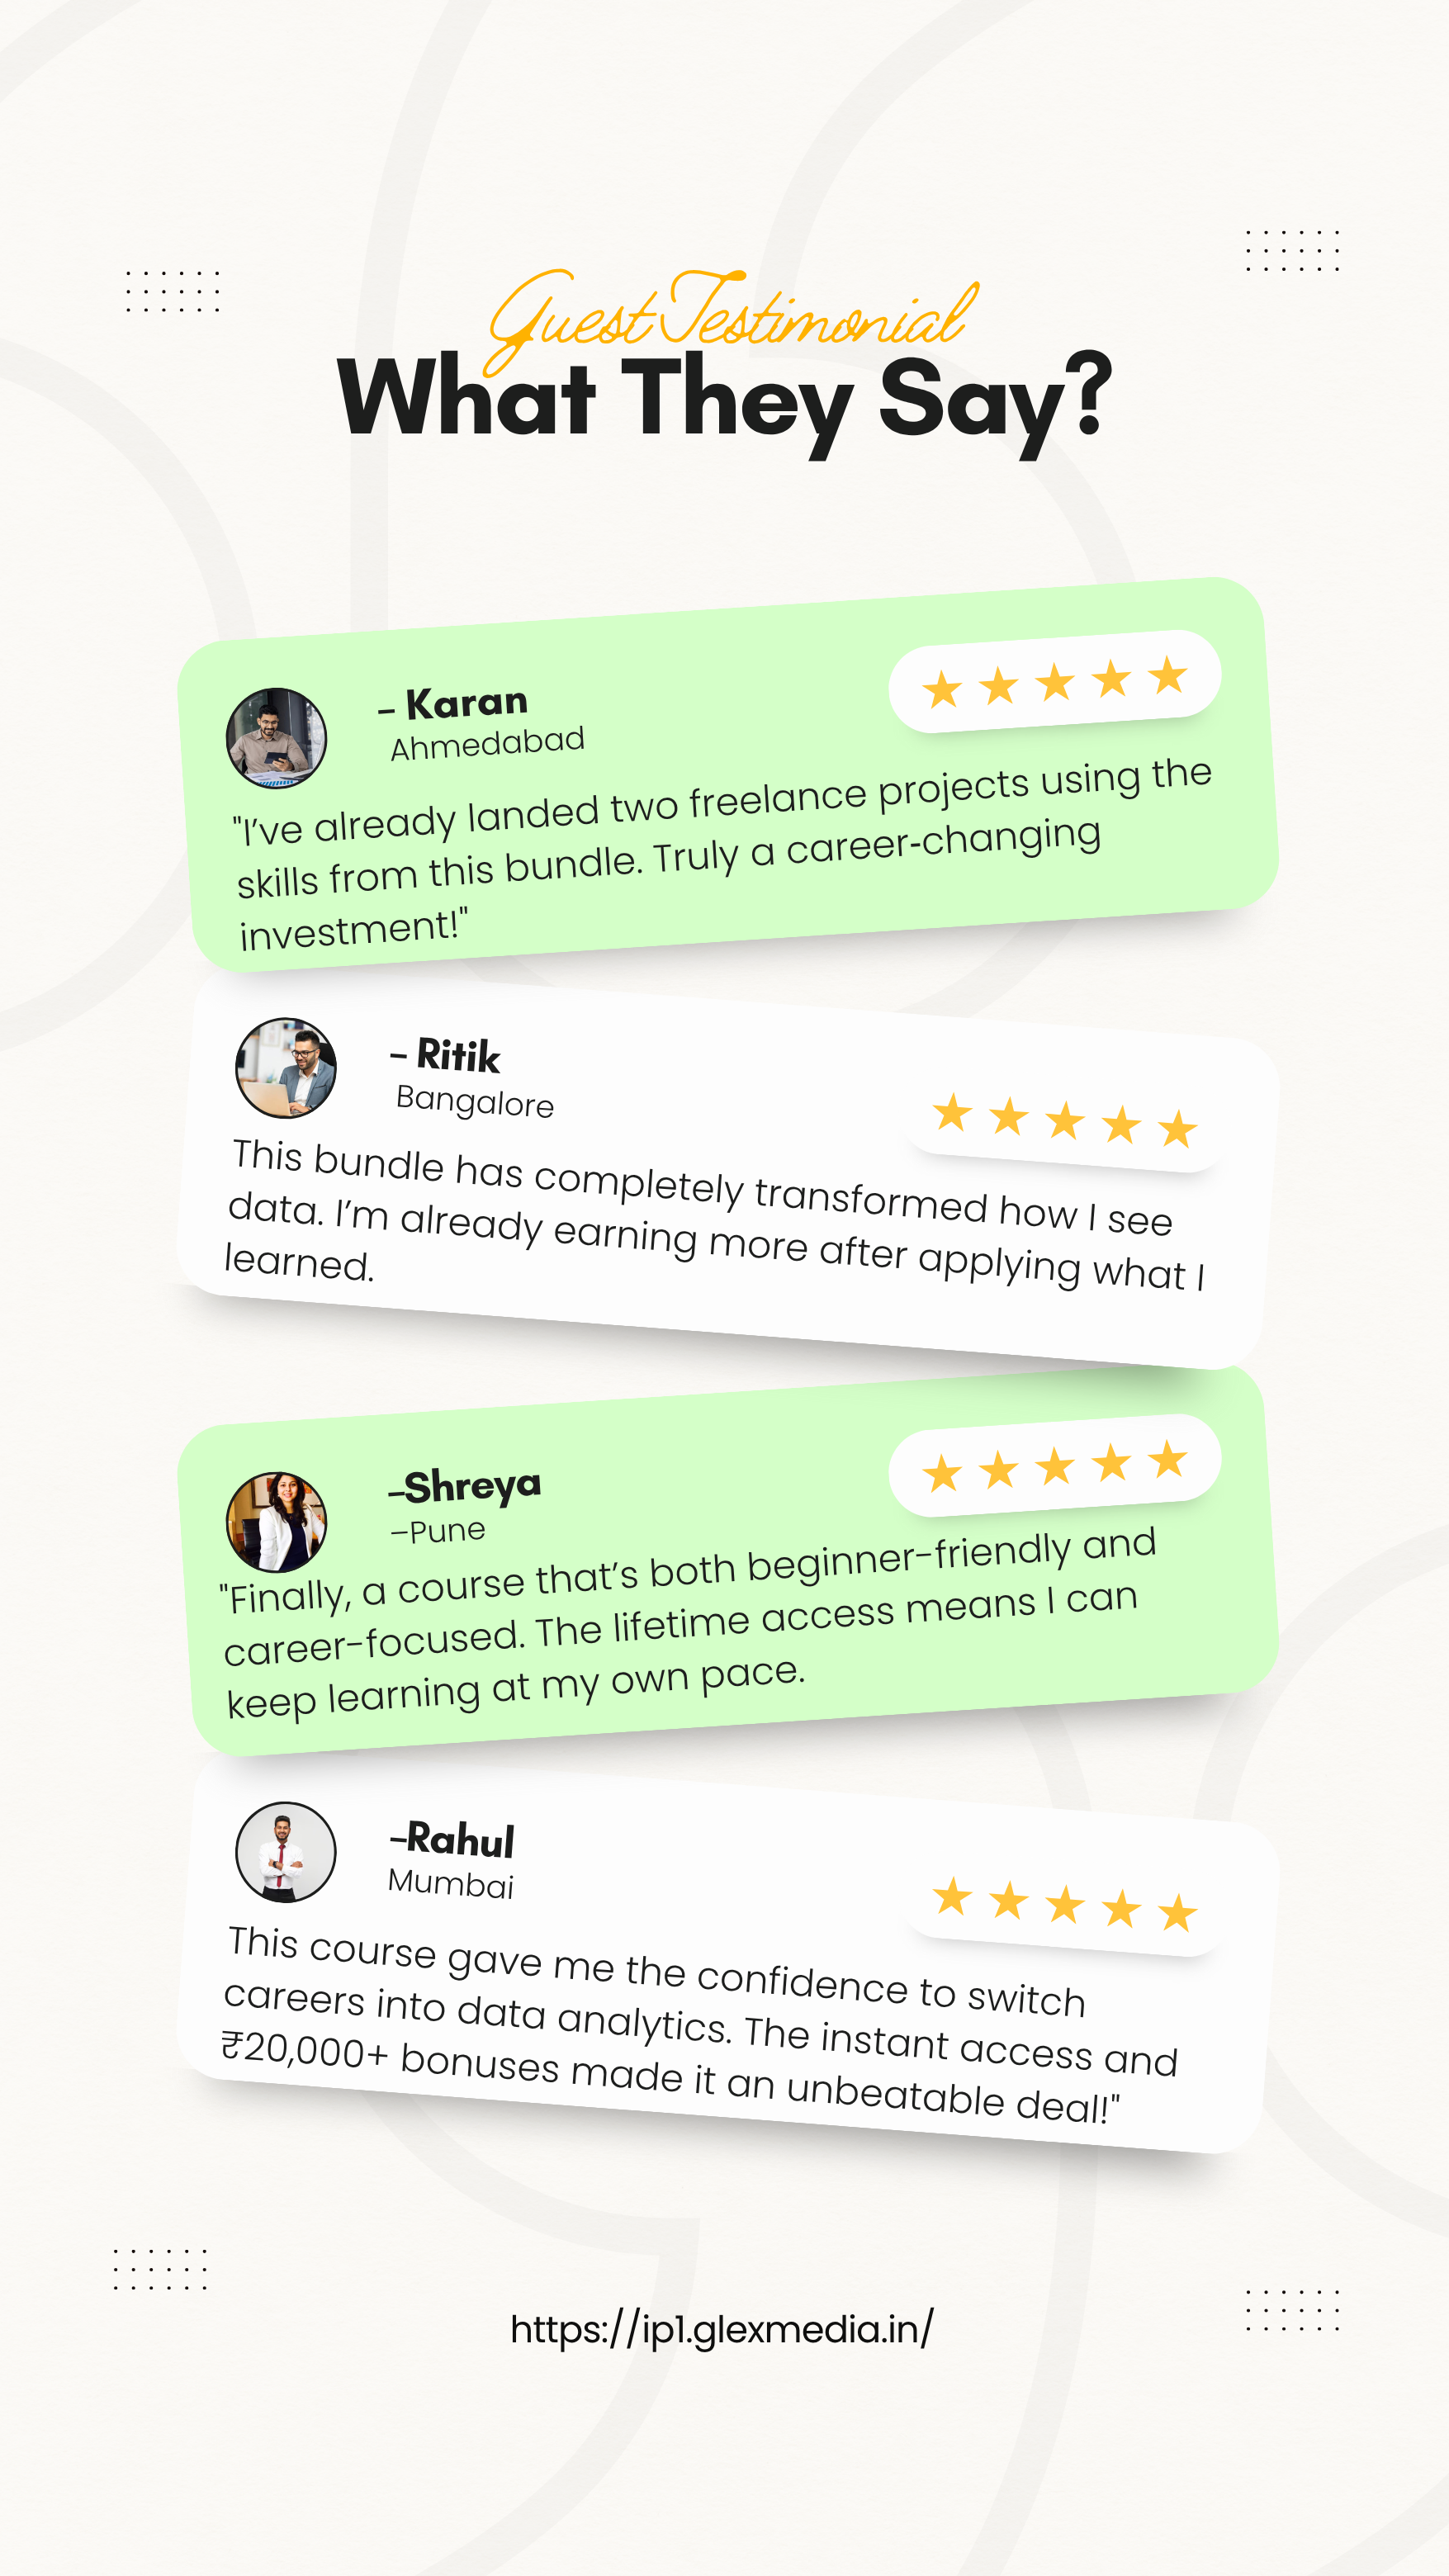
- 4.8/5 Average Rating
- Instant Download Access
- 700+ Happy Customers
Most Advanced & Updated Data Analysis Course 2025 🤖 All in One Comprehensive Bundle!👨💻
- 📢 Only 100 Seats Very Few Left…
HURRY! ✨Grab Your seat Now As We Can Only Fit 100 Attendees Per Session, and Seats Are Filling Up Fast!!!🙌
WHAT YOU WILL LEARN IN THIS COURSE?
193+ Video Lessons

This course covers basic to advanced topics, which are taught by different subject matter experts.
SELF SUFFICIENT

After this course, you’ll have complete clarity on chatgpt.
3000+ Chat GPT Prompts

Elevate your chatbot’s performance with our 33-video Prompt Engineering Mastery Course
BASIC TO ADVANCE

No matter what you know, this course teaches you from basic terms to advance levels.
1500+ AI Tools Mater List
Access over 1500+ AI tools Master List to supercharge your projects
ALL CONCEPTS COVERED

With this course you learn each and every aspect of chatgpt.
The Struggles You Face…
Please Check These Boxes If Your Answer Is A “Yes”
- I want to shift to a high-paying career but don’t know where to start.
- I waste hours manually preparing Excel reports.
- I want to use AI tools like ChatGPT but don’t know how they work with Excel or Python.
- I feel stuck in my job with no growth in skills or salary.
- I’ve tried learning from YouTube, but it’s too scattered and confusing.
- I want to learn Data Analysis tools like Excel, Power BI, SQL, and Python — all in one place.
- I don’t have time for a long course – I want a fast, practical solution..
Here is What You'll Get In This
👨🏻💻7-in-1 Data Analysis Course Bundle
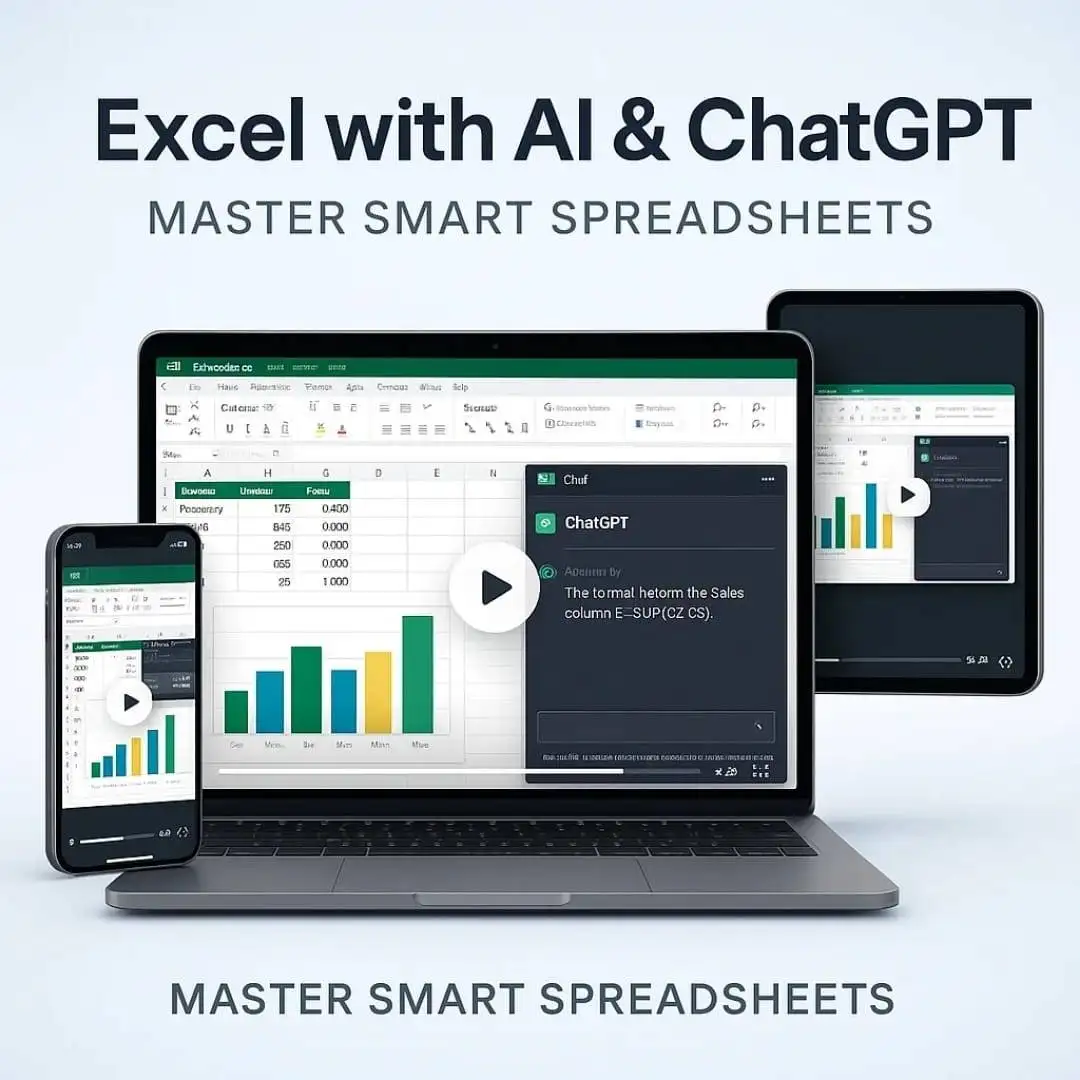
Unlock the true potential of Excel with AI-powered features and learn how ChatGPT can save you hours of work! Master automation, advanced formulas, and how to leverage AI to make smarter data-driven decisions.
20+ Modules | 3+ hour
📘 Excel Basics & Navigation
Interface overview
Ribbon, tabs, and quick access toolbar
Workbook vs Worksheet
Navigation techniques 🖱️
📂 Workbook & Worksheet Management
Creating & saving workbooks
Renaming, copying, grouping, moving sheets
Managing multiple sheets/workbooks view 🖱️
⌨️ Data Entry & Formatting
Entering text, numbers, dates
Formatting cells: font, color, alignment
Merging cells, wrap text, number formatting
🧮 Formulas & Functions
Basic math operations (BODMAS)
Common functions: IF, SUMIF, COUNTIF, TEXT, DATEDIF, IFERROR
Cell referencing (relative, absolute, 3D)
🔍 Formula Management & Auditing
Displaying formulas
Formula text & trace auditing
Watch Window, Named Ranges, copying formulas 🖱️
🧰 Data Tools
Sorting & Filtering
Remove duplicates, Find & Replace
Text to Columns, Data Validation
Flash Fill
📊 Charts & Data Visualization
Creating different chart types
Formatting chart elements
Trendlines, Sparklines, Recommended Charts
📈 Pivot Tables
Creating and referencing Pivot Tables
Drill down, grouping, summarizing data
Refresh & manage Pivot data
🗂️ Tables & Lists
Converting ranges to Tables
Fill Handle, AutoFill, Pick Lists
Custom Table Styles
🎨 Conditional Formatting
Basic rules, color scales, icon sets
Top/Bottom rules
Custom conditional formats
🖨️ Printing & Page Setup
Print Area, Print Titles, Margins
Orientation, Scaling
Headers/Footers, Page Breaks 🖱️
⏰ Date & Time Management
Static & Dynamic dates
Time calculations
Duration over 24 hours
🔒 Protection & Security
Protect worksheet/workbook
Lock specific cells for data entry
Password protection & restrictions
🖼️ Charts & Graphics
Inserting Shapes, SmartArt, Images, Screenshots
Formatting objects, object grouping 🖱️
⌨️ Keyboard Shortcuts & Productivity Tips
Ctrl key tricks, Ribbon shortcuts
Drag & Drop, Format Painter
Customize Quick Access Toolbar
👥 Review & Collaboration
Adding Comments, Spell Check
Sharing via OneDrive/SkyDrive
Tracking changes, co-authoring
🧾 Templates & Themes
Using Excel Templates
Creating custom templates
Applying & modifying themes
📐 Advanced Tools
Goal Seek, What-If Analysis
Scenario Manager
Watch Window (Advanced use)
📑 File Info & Layout Views
Displaying sheet names in cells
Layout View, Page Break Preview
Document Properties
🧩 Miscellaneous Features
Hyperlinks, SmartArt
Format Painter, Fill Handle
Object Grouping, Right-Click Tips 🖱️
2. VBA Macros - Basic to Advanced:
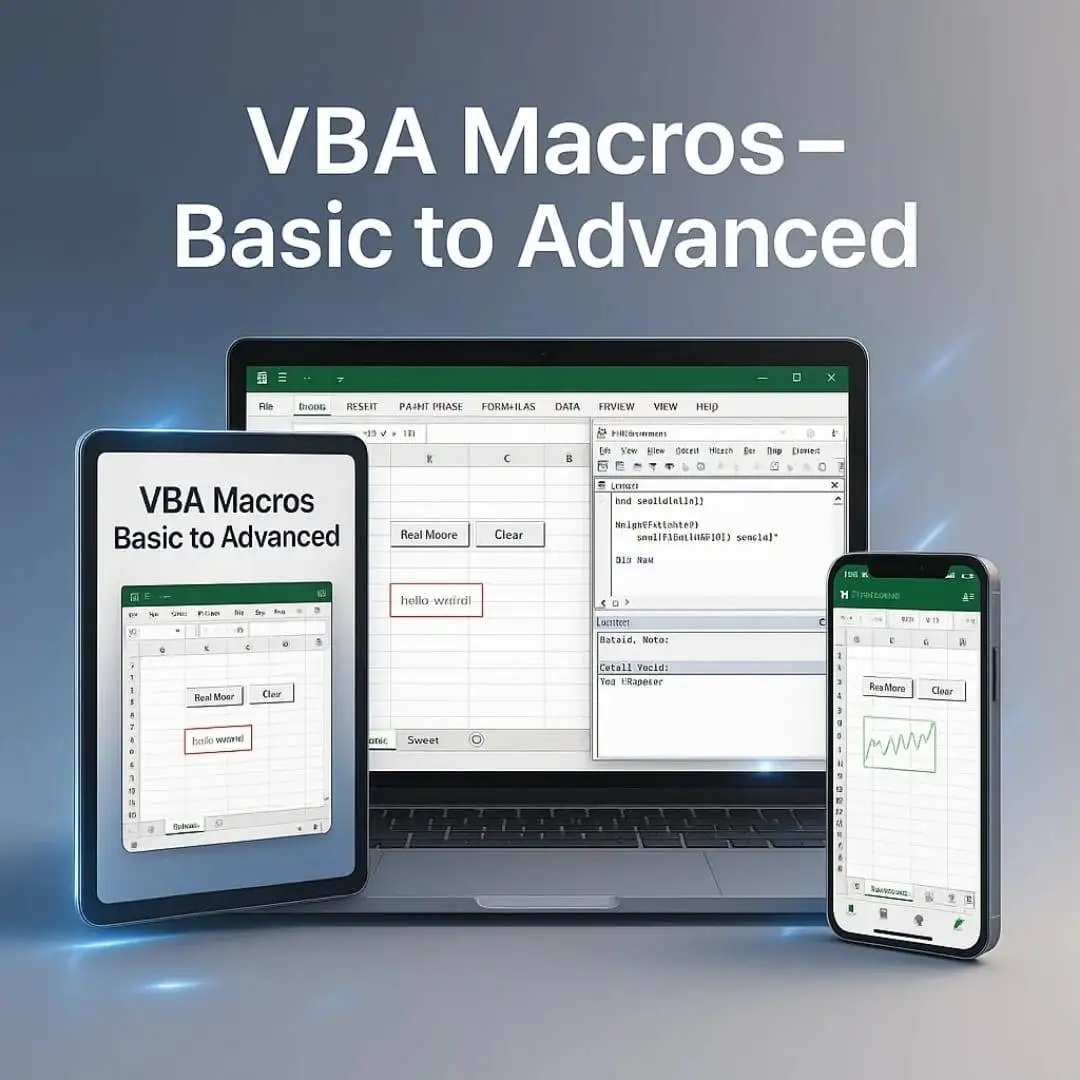
Automate repetitive tasks and free up your time by learning VBA Macros from the ground up. Save hours every week and increase your productivity like never before.
20+ Modules | 3+ hour
English
🛡️ 1. Macro Security and Setup
Enable/disable macros securely
Trusted locations
Setup of Personal Macro Workbook
Assign macros to ribbon/buttons 🖱️
🧩 2. Customizing the Ribbon
Add custom tabs/groups
Add macro buttons to Ribbon/Quick Access Toolbar
Icon customization for usability
▶️ 3. Creating and Running Macros
Record your first macro step-by-step
Run macros with buttons or shortcuts
Assign macros to shapes/buttons 🖱️
💬 4. User Interaction
Use
MsgBoxfor notificationsUse
InputBoxto get user inputIntro to UserForms for custom input forms
🐞 5. Writing and Debugging Code
Use the Visual Basic Editor (VBE)
Error handling with
On ErrorDebugging tools: Breakpoints, Step Into, Watches
📊 6. Working with Data
Access and format ranges and cells
Use arrays for bulk data handling
Work with dates and times in VBA
🔁 7. VBA Control Structures
If...Then...Else,Select CaseLooping:
Do While,For...NextEfficient flow control logic
🖼️ 8. UserForm Design
Insert and design UserForms
Add controls: buttons, textboxes, combo boxes
Handle form-based input and validation
📦 9. Handling Variables and Constants
Declare
Dim,Private,PublicvariablesUse constants for fixed values
Understand variable scope (module vs global)
🎯 10. Triggering Macros
Assign macros to keyboard shortcuts (Alt + key)
Use Ribbon buttons or worksheet controls
Automate with Workbook/Sheet events
🧱 11. Function and Sub Procedures
Create reusable Subs and Functions
Pass arguments to procedures
Organize code into modules
📅 12. Worksheet and Workbook Events
Automate with
Workbook_Open,Worksheet_Change, etc.Track activity: saving, activating, deactivating
Event-driven automation
🔧 13. Range and Cell Manipulation
Modify content, formatting using
.Value,.Font,.OffsetClear contents, apply formats programmatically
Loop through cells/ranges
📘 14. VBA Functions and Methods
Use Excel functions via
WorksheetFunctionApply operators for logic/math
Custom calculations and string operations
⚡ 15. Optimization and Speeding Up VBA
Turn off screen updating & auto calculation
Use efficient referencing (With…End With, absolute vs relative)
Minimize runtime for large datasets
3. Python & SQL for Data Analysis:
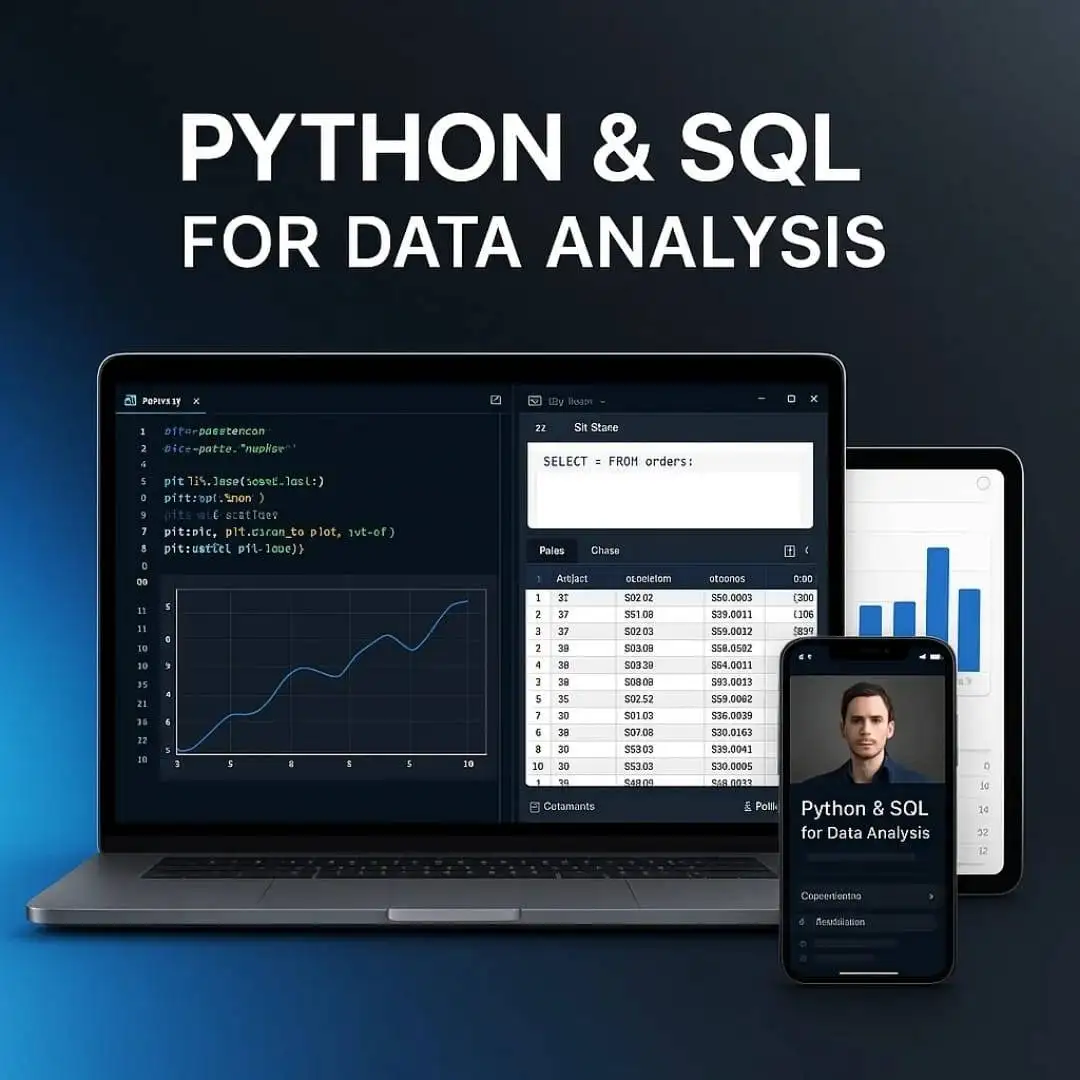
Learn Python and SQL from scratch and harness their power to manipulate, clean, and analyze large datasets.
Unlock deep insights that can transform your decision-making process.
30+ Modules | 65+ Videos | 4+ hour
English
📘 01 – Introduction to Data Analysis
What is Data Analysis?
Importance, tools, and real-world applications
🧮 Excel for Data Analysis
🟢 02 – Master Excel for Data Analysis
Navigating Excel as a data tool
Built-in features for analysts
📁 03 – Managing and Analyzing Data
Structured vs. unstructured data
Organizing data tables
🔃 04 – Sorting Data
Single/multi-level sort
Custom sort orders
➕ 05 – Creating Automatic Subtotals
Insert subtotal rows in sorted lists
Grouping and outline view
🔍 06 – Filtering Data
AutoFilter basics
Working with text, numbers, and date filters
🧠 07 – Advanced Filtering
Custom filter conditions
Copy filtered data to new range
🚫 08 – Eliminating Duplicate Data
Remove Duplicates tool
Best practices to ensure clean datasets
🧑💻 SQL for Data Analysis
🟣 09 – Master SQL for Data Analysis
SQL as a tool for structured data querying
💻 10 – SQL Installation
Tools: MySQL / PostgreSQL / SQLite setup
📖 11 – SQL Overview
SELECT, FROM, WHERE, and more
📐 12 – Fundamental Concepts
Tables, columns, rows, keys, constraints
🔗 13 – Relationships
Primary and foreign keys
Join types (INNER, LEFT, RIGHT, FULL)
🔤 14 – Strings
Concatenation, length, substring, pattern matching
🔢 15 – Numbers
Arithmetic functions and expressions
🕒 16 – Dates & Time
Date formats, calculations, and functions
🔢 17 – Aggregates
COUNT, SUM, AVG, MIN, MAX, GROUP BY
💳 18 – Transactions
COMMIT, ROLLBACK, SAVEPOINT
⚡ 19 – Triggers
Event-based automation in tables
👁️ 20 – Views & Subselects
Create virtual tables & use nested queries
🛠️ 21 – CRUD Applications
Create, Read, Update, Delete operations
📊 22 – Data Reporting and Analysis in SQL
Transform raw data into meaningful reports
📋 23 – Use SQL to Report Data
Building summarized datasets and views
📚 24 – Grouping Your SQL Results
GROUP BY with multiple columns
HAVING vs WHERE
🔗 25 – Merge Data from Multiple Tables
JOINs in depth, UNION, and subqueries
🎯 26 – More Advanced SQL
CTEs, Window Functions, Recursive queries
🐍 Python for Data Analysis
🔰 27 – Introduction
Why Python for Data Analysis?
Tools: Jupyter, Pandas, NumPy
🐍 28 – Data Analysis with Python
Load, clean, and manipulate datasets
Working with CSV, Excel, and JSON files
📊 29 – Statistical Operations in Python
Mean, median, mode, standard deviation
Correlation and regression basics
🧪 30 – Hands-On Data Analysis Practice with Python
Real-world projects and datasets
Exploratory Data Analysis (EDA)
4. Power BI for Data Analysis:
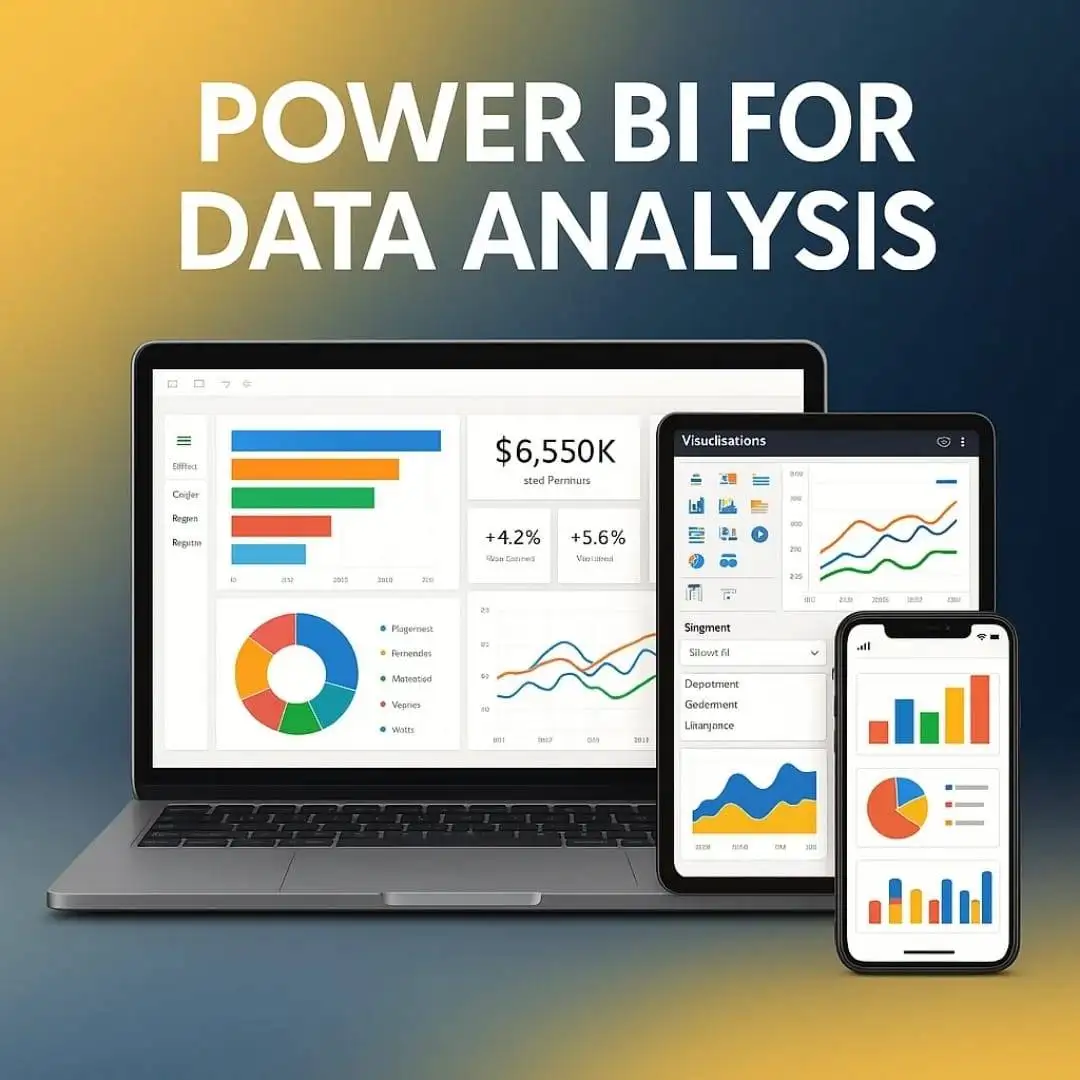
Create stunning, interactive dashboards that will wow your colleagues and clients. Learn how to visualize complex data with ease and tell compelling stories that drive action.
20+ Modules | 7+ hour
English
📊 Power BI Course Syllabus
🟡 Power BI Part 1: Core Foundations
🔧 1. Introduction & Setup
Explore Power BI Desktop interface
Connect data sources
Create your first simple report
🧹 2. Data Prep & Transformation
Use Power Query Editor
Clean, format & enrich raw data
Remove errors, split columns, change types
🧠 3. Modeling & DAX Basics
Create data models and relationships
Calculated columns vs. measures
Learn DAX basics: SUM, IF, RELATED
🕒 4. Advanced DAX & Time Intelligence
Use Time Intelligence functions
Cumulative totals, YTD, MTD, QTD
Compare periods with SAMEPERIODLASTYEAR
📈 5. Report Creation & Navigation
Finalize reports with filters & slicers
Dynamic ranking, What-If parameters
Scenario analysis & interactive visuals
🟠 Power BI Part 2: Intermediate Skills
🧭 6. Interface & Data Preparation
Interface tour refresher
Clean & shape datasets using Power Query again
🔗 7. Enriching Data & DAX
Import Date Tables
Create DAX Measures for KPIs
Use variables, SWITCH, and LOOKUPVALUE
📅 8. Time Intelligence & Advanced DAX
Implement running totals, growth %
Dynamic time-based comparisons
DAX for trend & sales rankings
📊 9. Final Report & Insights
Build polished, professional dashboards
Use tooltips, bookmarks, drillthrough
Perform scenario analysis using What-If
🔵 Power BI Part 3: Mastering DAX with CALCULATE
🧮 10. CALCULATE Function
Understand filter context deeply
Use CALCULATE to change context dynamically
🧲 11. Using Filters & Time Intelligence
Apply complex filters in DAX
Combine CALCULATE + Dates functions
📊 12. Advanced DAX & Sales Analysis
Sales classifications using nested CALCULATE
Context transition explained
Dynamic selections with slicers & DAX
5. Tableau - Basic to Advanced:
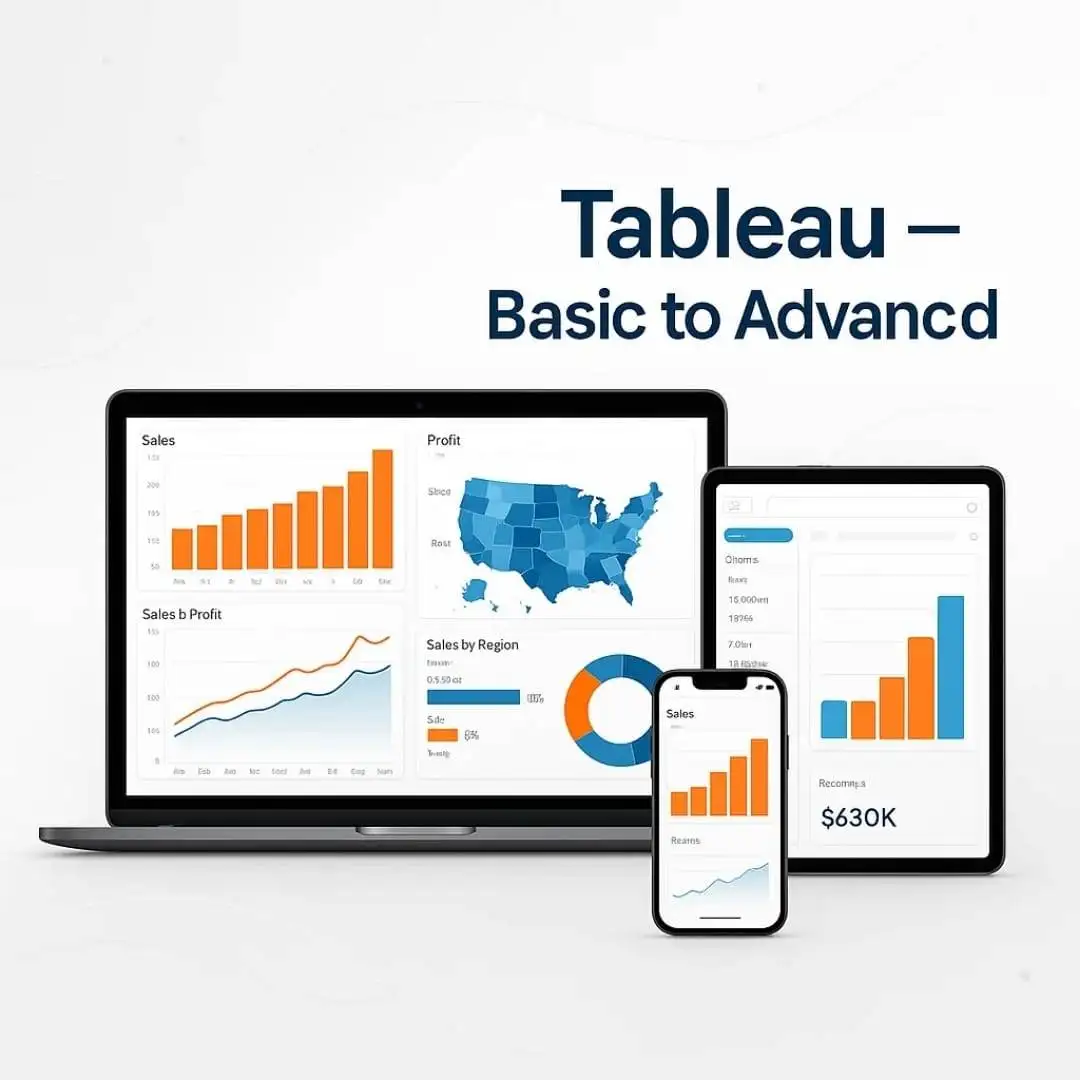
Master Tableau and create impactful data visualizations that transform raw data into meaningful insights. Impress stakeholders with your polished, professional reports.
12+ Modules | 30+ Videos | 6+ hour
English
Tableau Course Syllabus (Beginner to Advanced)
🟢 Beginner: Introduction to Tableau
🎓 1. Course Intro
Overview of Tableau
Course structure & learning goals
📂 2. Tableau Files
Download and use exercise files
Setup working environment
📊 3. Tableau Basics
Understand BI & data visualization
Introduction to Tableau interface
🔗 4. Data Connection
Connect Tableau to Excel, CSV, Google Sheets, etc.
Preview and load datasets
🖥️ 5. Workspace & Views
Explore Tableau workspace: shelves, cards, panes
Build simple views
🔁 6. Multiple Data Sources
Use joins & blending with multiple datasets
Understand data relationships
🧪 7. Exercise
Hands-on: Build your first charts and dashboards
🌱 Beginner: Bringing Data to Life
📈 8. Chart Types
Choose the right chart for your data (Bar, Line, Pie)
🧱 9. Building Views
Create views using drag-and-drop
Formatting and design tips
📊 10. Histograms & Scatter Plots
Explore data distribution
Discover correlations
🗺️ 11. Spatial Charts & Dashboards
Build geographic maps
Combine sheets into dashboards
📤 12. Publishing & Sharing
Publish to Tableau Public or Server
Create and share Stories
🧩 13. Exercises
Additional hands-on projects to reinforce learning
🧮 Beginner: Calculations and Expressions in Tableau
✏️ 14. Expressions
Create custom expressions and calculated fields
➗ 15. Numeric & String Calculations
Perform calculations on text and numbers
❓ 16. Conditional & Analytical Functions
Use IF, CASE, ZN, WINDOW functions
🧠 17. Exercises
Practice using calculations through real-life scenarios
🔵 Advanced: Calculations & Functions
⚙️ 18. Advanced Techniques
Nested calculations, logic control
Error handling in expressions
🎚️ 19. Parameters
Create interactive dashboards with user input
📏 20. Level of Detail (LOD) & Groups
FIXED, INCLUDE, EXCLUDE calculations
Use Groups, Sets, and Hierarchies
🗺️ 21. Geospatial & Advanced Filters
Use advanced map layers and radius filters
🧮 22. Table Calculations
Moving averages, rank, percent of total
Advanced transformations
💡 Advanced: Improving Dashboards
🖱️ 23. Actions & Animation
Add interactivity using filters, highlights, and URL actions
📊 24. Advanced Charts
Funnel charts, Sankey, Waterfall, Bullet graphs
🌍 25. Geospatial & Marketing Dashboards
Target marketing with geo insights
Campaign tracking
💼 26. Sales Dashboard
Build a sales tracking dashboard with KPIs, trends, and filters
🧪 Advanced: Exercises
🧠 27. Exercises
Solve complex dashboard challenges
Final project: Build a complete interactive dashboard
5. Tableau - Basic to Advanced:
Unlock the true potential of Excel with AI-powered features and learn how ChatGPT can save you hours of work! Master automation, advanced formulas, and how to leverage AI to make smarter data-driven decisions.
20+ Modules | 3+ hour
The workshop will be for 2 hours and will be held on the Zoom App.
Please check the top section of this page to get your preferred date for the workshop.
The workshop will be for 2 hours and will be held on the Zoom App.
Please check the top section of this page to get your preferred date for the workshop.
For Whom Is This Courses For
- Students
- Freelancers
- Self-Employed
- Marketers
- Job Professionals
- Bussiness Owners
- Retired Owners
We are Offering You a 7 Day Money Back Guarantee!!!

DATA ANALYSIS COURSE BUNDLE
- If you don’t see an immediate benefit just let us know. we’ll gladly refund your money without any questions.
- Keep it for full 7 days if you wish. Even then, if you’re not continuing to grow yourself, or you’re not totally delighted – for any reason – simply let me know and you’ll receive an immediate refund.
- Save Time & Effort – Ready-to-use templates and tools speed up project planning and execution.
- Increase Earnings Potential–Deliver better results, attract more clients, and unlock higher-paying opportunities.
- Advance Your Career –Gain skills and tools that make you a valuable asset in any organization.
- Boost Professional Credibility –. Present structured plans that impress clients and stakeholders
- Deliver Projects on Time –. Proven frameworks help meet deadlines without stress.
- Improve Workflow Efficiency – . Streamline tasks and handle multiple projects with ease
BUT WAIT!!!
— I’ve Something More For You… —
When You Register For The “50 AI Tools To Make Money” 🚀Enroll Right Now… You Will Get 6Amazing Bonuses🎁 Worth ₹22,500 For Absolutely FREE!!!😃
Bonus #1
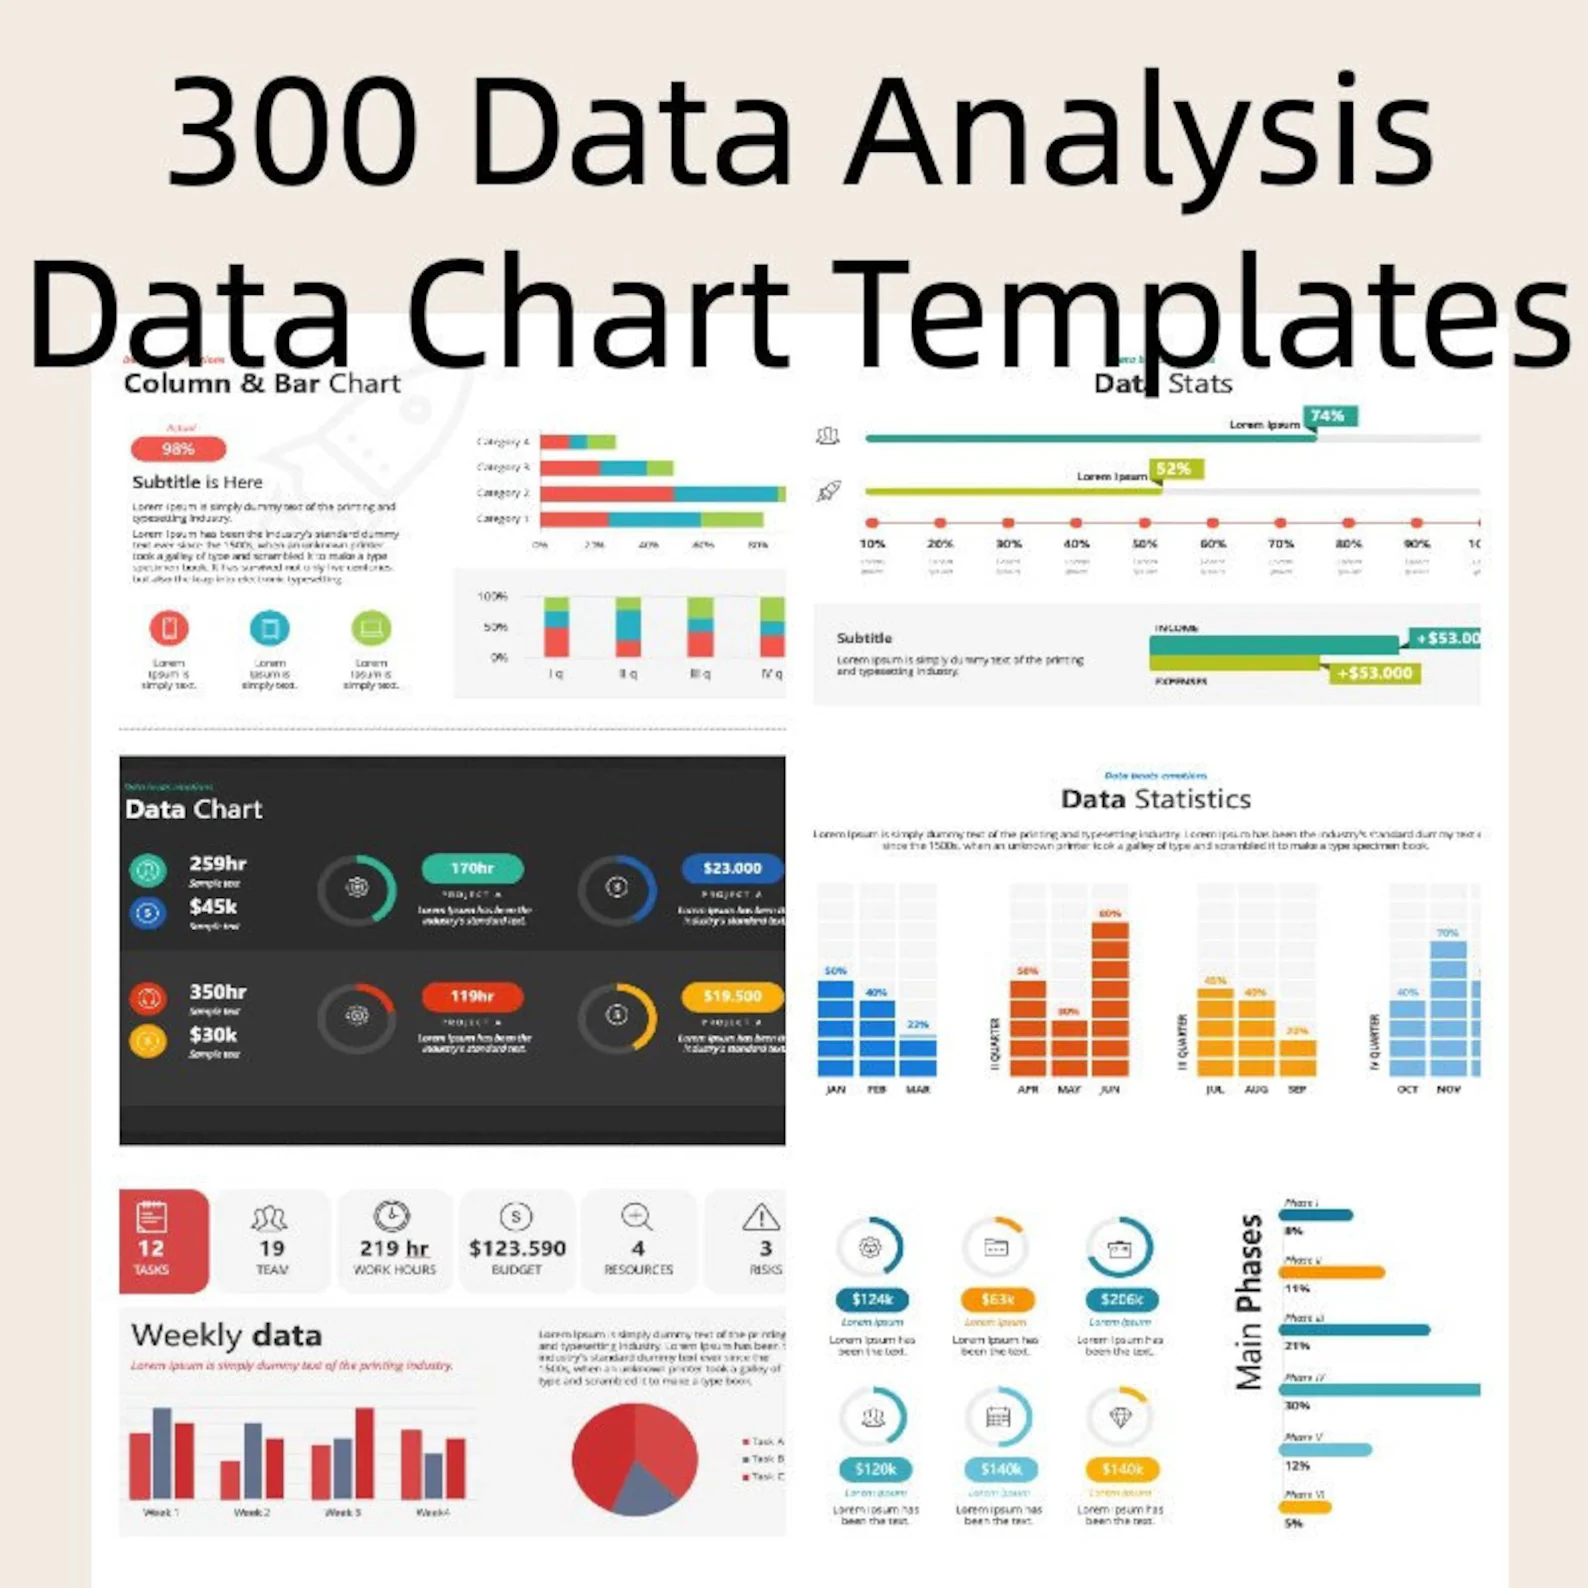
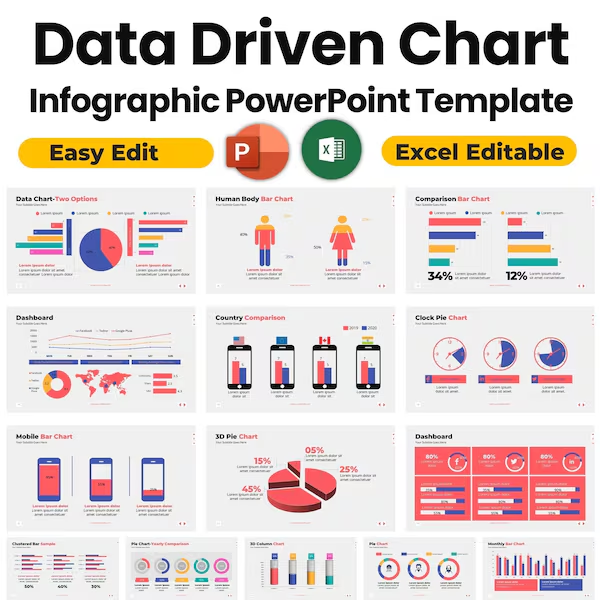
300 Data Analysis PowerPoint Template,
Boost your presentations with this 300 Data Analysis PowerPoint Template bundle – perfect for showcasing reports, insights, dashboards, charts, and business analytics. Fully editable, professional designs crafted for data-driven storytelling and impactful visual communication.
Priced: ₹ 3000/-
Bonus #2
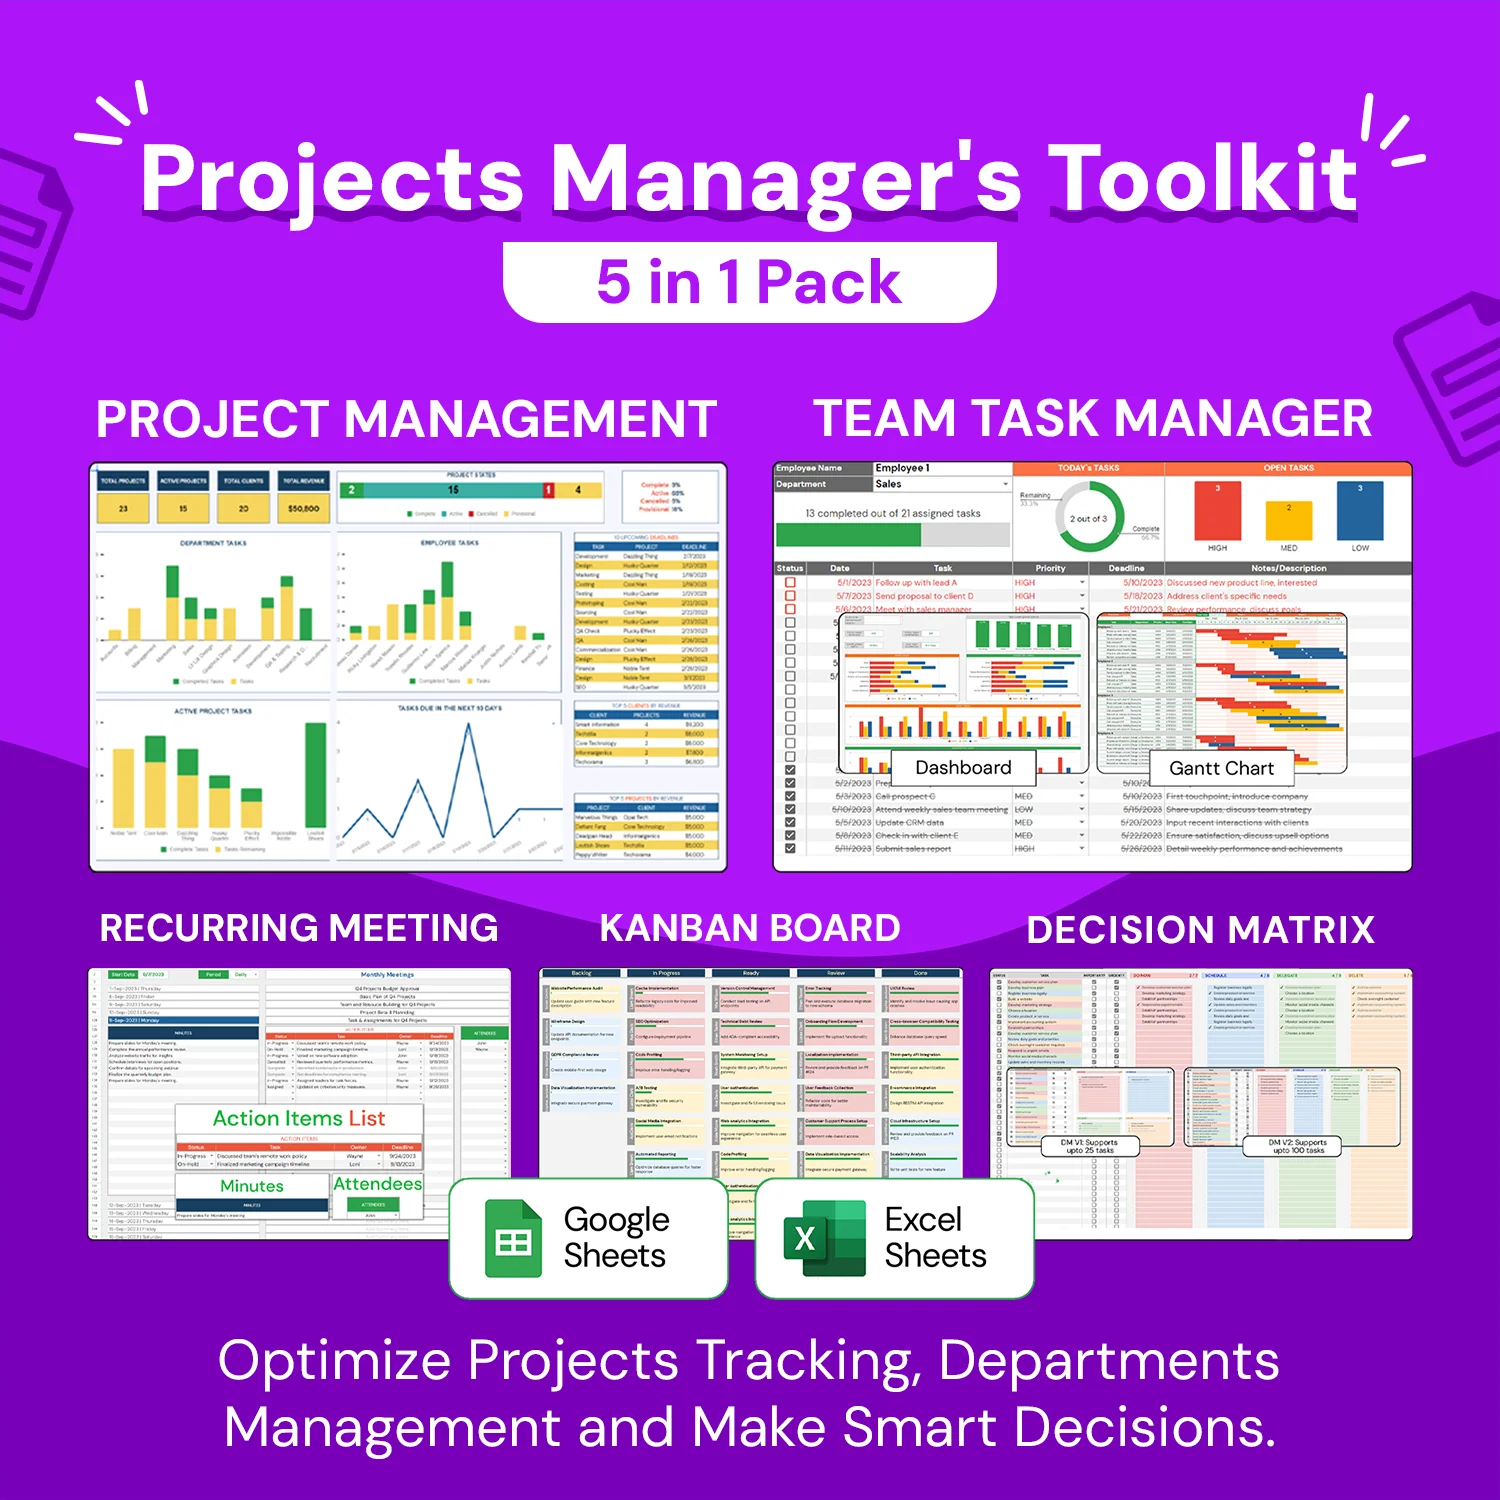
Projects Manager's Toolkit 5in1 Pack
Boost efficiency and deliver projects on time with the Projects Manager’s Toolkit 5‑in‑1 Pack. Includes essential templates, planning resources, and productivity tools designed to streamline workflows, enhance collaboration, and ensure successful project outcomes for managers and teams.”
Priced: ₹ 4500/-
Bonus #3
2500 PowerPoint Template Bundle Fully Editable Templates
Our PowerPoint Template Bundle is a must-have for anyone looking to create professional and visually appealing presentations. This bundle includes a variety of templates in different styles and formats, so you can find the perfect one for your needs.
Priced: ₹ 5000/-
Bonus #4

20+ AI Video Course Bundle
Ready to streamline your business, boost productivity, and create passive income using cutting-edge AI tools? This all-in-one AI toolkit is built for entrepreneurs, marketers, and creators looking to dominate the digital space in 2025 and beyond
Priced: ₹ 3000/-
Bonus #5

900+ Businesss Video Courses With Resell Rights
All-In-One MRR & PLR Video Course Mega Bundle – 900+ Ready-to-Sell Courses! Supercharge your business with this massive, done-for-you video course library. With 900+ high-quality courses covering hot niches like marketing, sales, e-commerce, entrepreneurship, mindset, and more—you’ll have everything you need to educate, resell, and profit!
Priced: ₹ 4500/-
Bonus #6
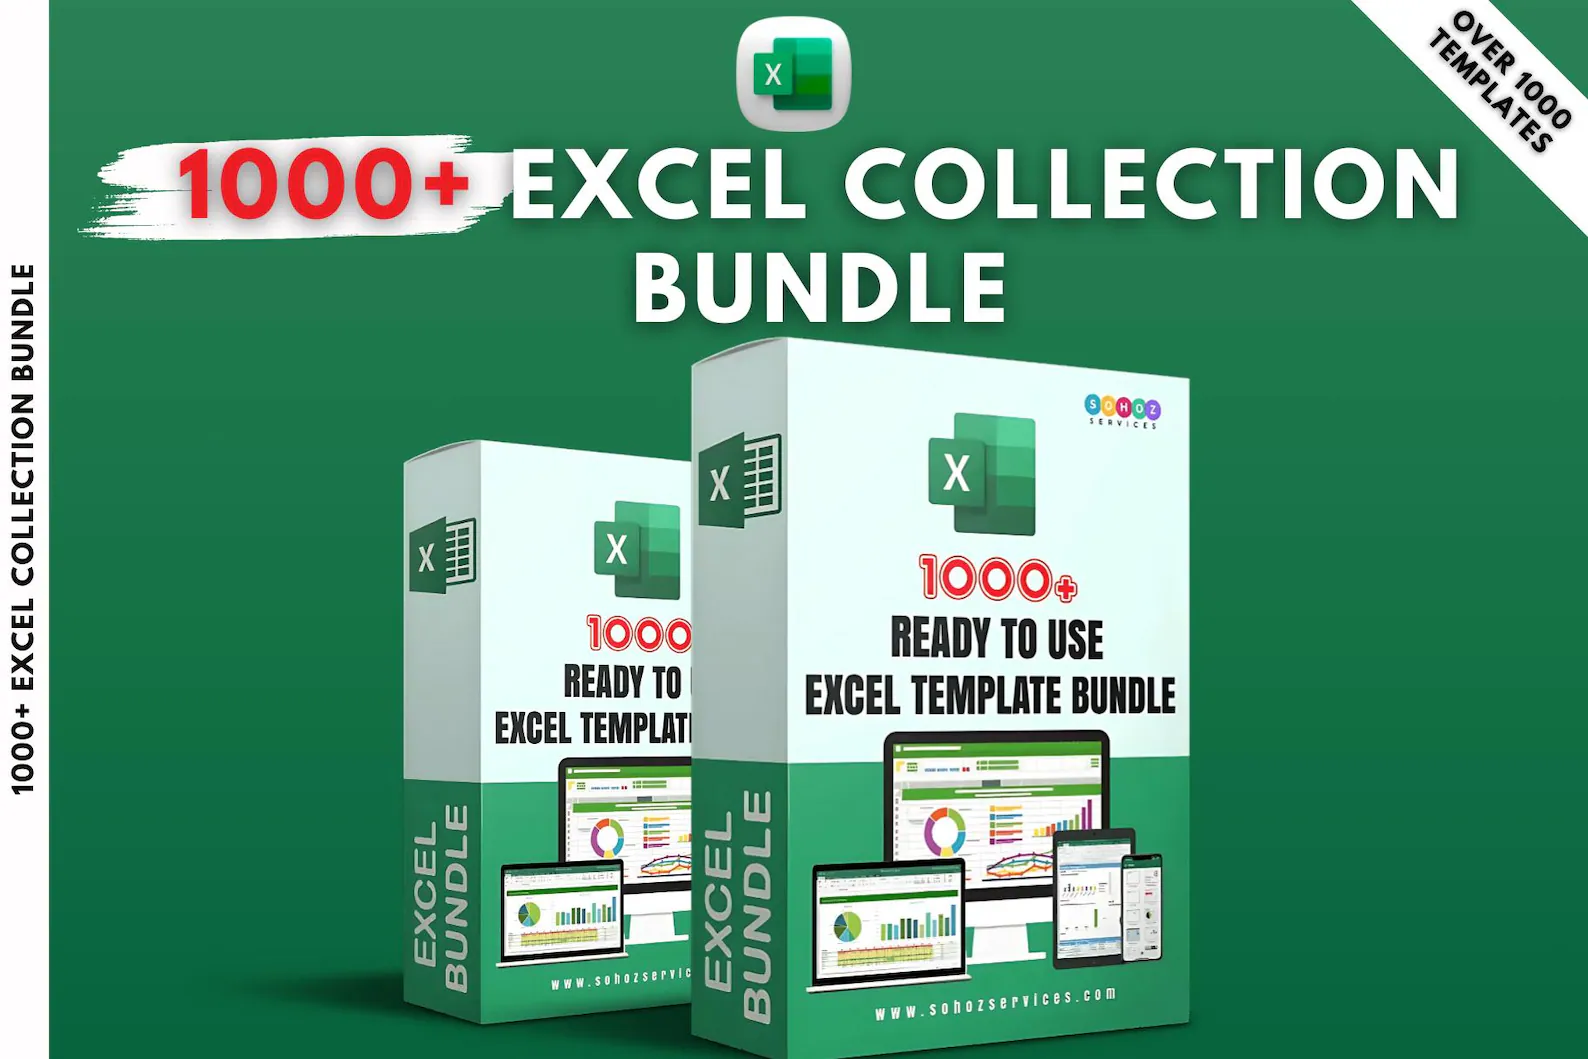
1000+ Excel Collection Bundle
Get the ultimate 1000+ Excel Collection Bundle featuring spreadsheet templates, financial models, business planners, and data analysis tools. Ideal for professionals, startups, and analysts to save time, boost productivity, and streamline business operations with ready-to-use Excel sheets.
Priced: ₹ 5000/-
Get All This Inside The Workshop
Total Value Of Bonuses: ₹22,500
[Normal Workshop Ticket Price: -9999/-
Buy Today At Just ₹299 /-🎉
Frequently Asked Questions
You get 7 expert-led courses covering data analytics, visualization, predictive modeling, and real-world projects designed for beginners to pros.
Ideal for students, job seekers, professionals, and anyone looking to upgrade their data analytical skills for career growth.
Yes! Mastering data analytics opens doors to high-demand roles, promotions, and better salary opportunities in the data-driven industry.
No. The courses are structured to guide you from beginner basics to advanced analytics, making learning easy and practical.
Yes, all modules are updated with the latest data tools, techniques, and industry trends to keep you ahead.
Instant download and access upon purchase – start building your data analysis expertise right away.
Simply click the “Button” button on our website, complete the secure checkout, and you’ll get instant download access to the 7‑in‑1 Data Analysis Course Bundle.
Yes! You’ll receive ₹20,000+ worth of exclusive bonuses completely free with your purchase – including premium resources, templates, and additional learning material.